|
|
|||||||||||||||||||||||||||||||||||||||||||||||||||||||||||||||||||||||||||||||||||||||||||||||||||
|
|
|||||||||||||||||||||||||||||||||||||||||||||||||||||||||||||||||||||||||||||||||||||||||||||||||||
 |
|||||||||||||||||||||||||||||||||||||||||||||||||||||||||||||||||||||||||||||||||||||||||||||||||||
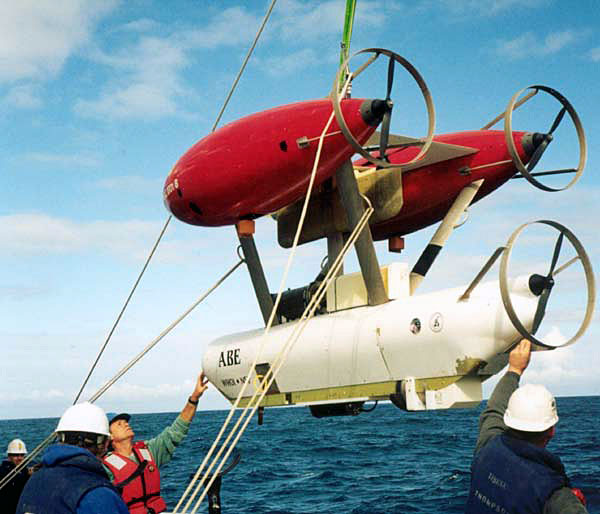
As part of the ABE group, it is my task to process the multibeam sonar collected by ABE on its nightly sojourns into the deep into maps of the bathymetry around and including the Lost City site. ABE has been recently equipped with an SM2000 multibeam sonar unit that provides exceptionally detailed maps of the rough topography at the summit of the Atlantis Massif. A dedicated PC104 stack in the main electronics housing on ABE records the raw signals (in-phase and quadrature) from each of 80 receiving elements within the SM2000 unit onto a hard disk. After ABE returns to the surface following completion of its mission, I download this data onto my computer and begin the processing of this raw data into bathymetry.
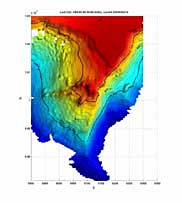
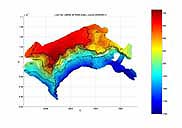
Saving the raw signals on ABE allows for tremen-dous flexibility in processing. First the raw signals are beam-formed. The beam-formed data then passes through a bottom detection algorithm which returns a range-to-bottom on every beam. These ranges, combined with the known angle of each beam are then combined with vehicle position and attitude data from some of ABE's other sensors and the result registers each bottom return in a global coordinate frame. At this point in the process, the bathymetry exists as a 'point cloud.' Following gridding, which smoothes the data to some extent, the bathymetry can be plotted as a map. The resolution of the maps created in this way have revealed many details about the Lost City site and surrounding terrain that are impossibly obscured in acoustic bathymetry collected from the ship, but that are at a much larger scale than are visible out of Alvin's viewports. Maps generated by ABE taken down by Alvin operators and the scientists on every dive help to navigate the vent field.
Because ABE flies low over the bottom (about 40 m) and follows the terrain, each sonar beam only covers a small portion of the bottom and a precise (~0.5 m) range-to-bottom can be collected that represents about a square meter of the ocean floor. This is in contrast to typical ship mounted sonar systems, where each beam might insonify 10s to 100s of square meters of the bottom in deep waters. The large number of dive opportunities on this cruise has afforded us the opportunity to try some new mapping techniques. As mounted on ABE, the SM2000 can be swiveled to point up to 60 degrees to one side. This arraingment is courtesy of Rod Catanach and has allowed us to map the steep cliff faces surrounding the Lost City site from the side and resolve their texture in detail.
Processing the sonar can be a frustrating process. There are a great many variables, some of which must be determined from the data itself, making the process iterative to some extent. But when a map comes together and reveals features like 100 sheer cliffs, 60 m tall spires and a pancake flat summit, I've found the work is very satisfying. |
|||||||||||||||||||||||||||||||||||||||||||||||||||||||||||||||||||||||||||||||||||||||||||||||||||