|
|
||||
|
|
||||
 |
||||
|
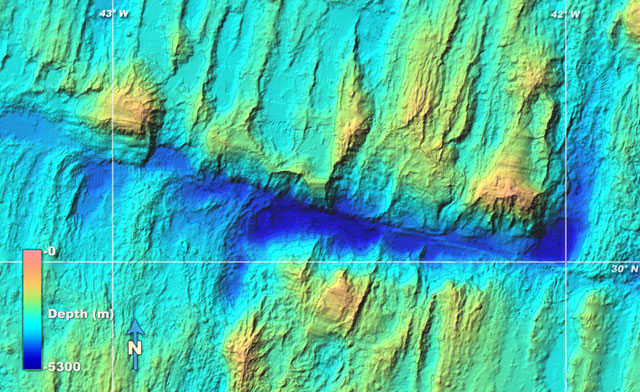
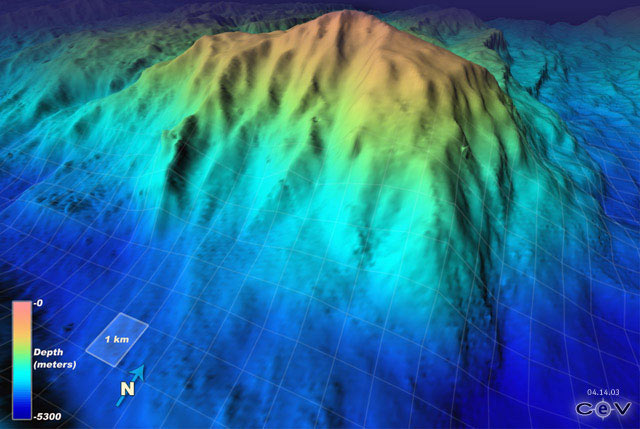
Regional What Does the Mid-Atlantic Ridge and Atlantis Fracture Zone Look Like?
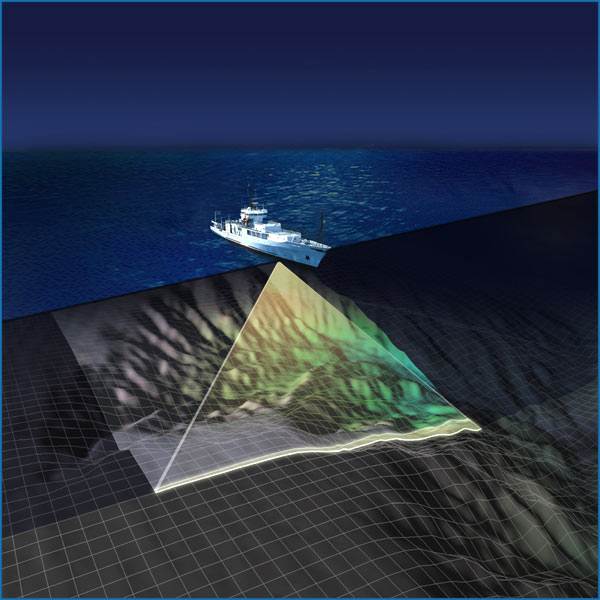
These multi-beam systems use sound to measure the distance from the surface of the sea to the seafloor. We know how fast sound travels through water (about 1480 m per second, or more than 3000 miles per hour). By knowing the angle that the beam of sound is projected at, and by measuring how long it takes for the beam of sound to travel to the seafloor, hit the bottom, and bounce back to the ship (where a hydrophone listens for it), we can calculate how deep the water is.
The mapping system on the Atlantis is called Seabeam. It projects 121 bathymetric points for every sound signal or “ping” that it sends out from its haul. The beam of sound is projected into the water in a pattern that extends down and outward from the ship making a large swath composed of multiple points. As the Atlantis moves over the sea's surface in a straight line at about 8 knots, the beams of sound sweep over the sea floor in a large swath. Measured at the sea floor, this acoustic swath is about twice as wide as the depth of the water. The travel time of a sound pulse from the ship to the sea floor and back is converted to a vertical depth, using the beam angle, the ship's heading and orientation (heave, roll, and pitch), and a sound velocity profile. The resultant depth data is merged with the Atlantis’s high-quality Global Positioning System (GPS) data to produce bathymetric maps. A contour map of the bottom is produced in near real-time and the data is processed after collection into much higher quality maps and images of the sea floor. |
||||