Supplemental figure S1 to Proskurowski et al. 2008

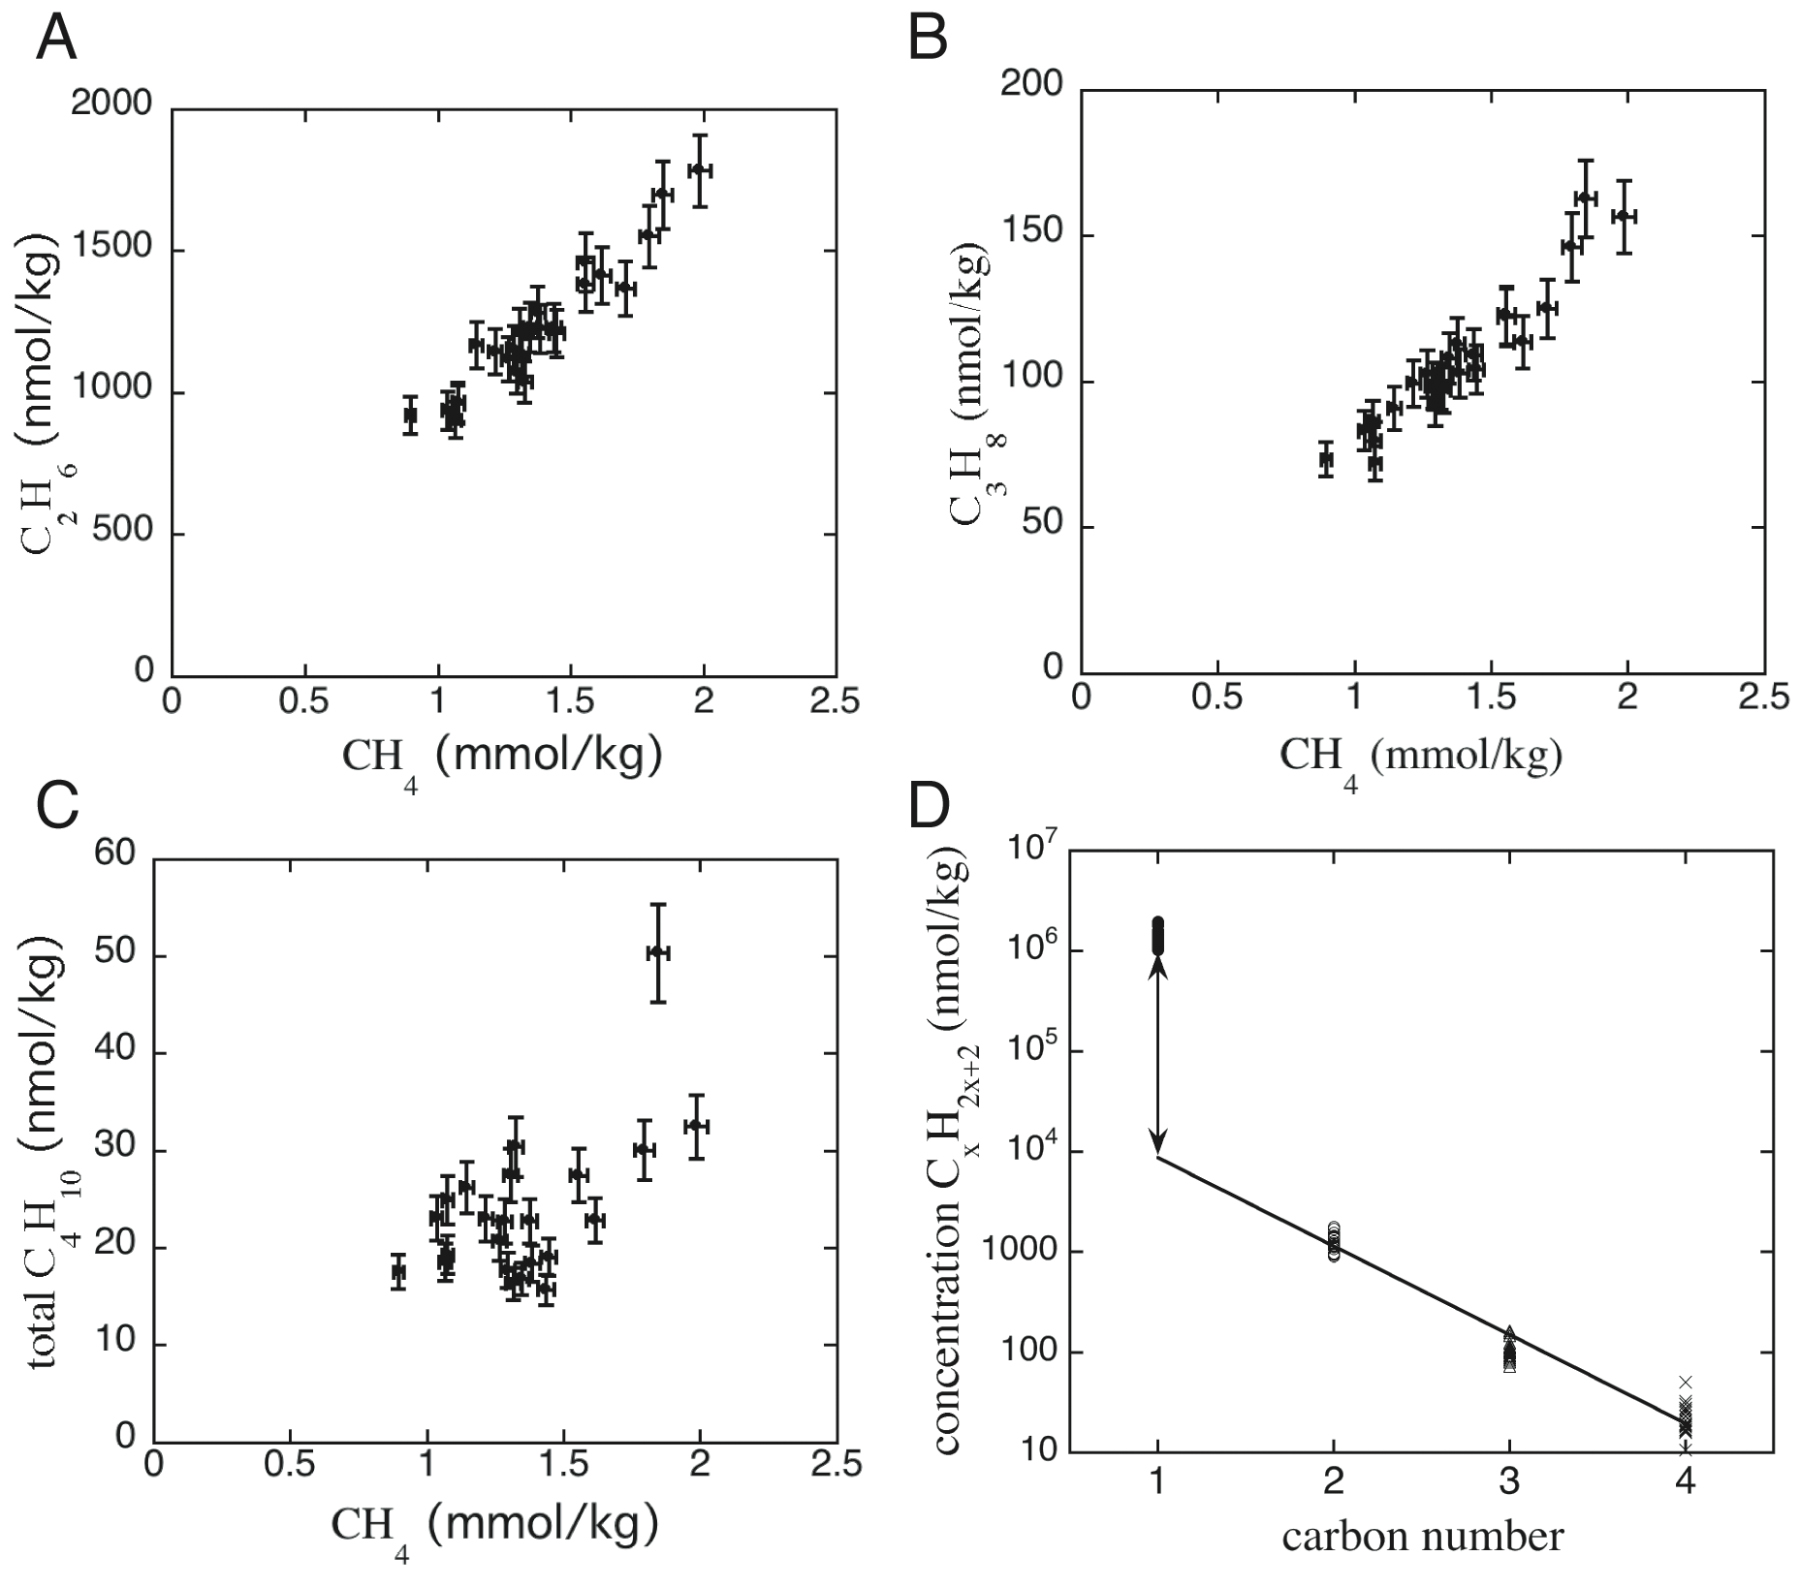
Fig. S1. Linear relation between Lost City alkane concentrations from Proskurowski et al., 2008.
(A) CH4 and C2H6, (B) CH4 and (C) C3H8. Error bars represent 7-10% error in C2-C4
alkane measurements, and 2% error in CH4 measurement. (D) Average Lost City alkane
concentration (nmol/kg) plotted on a log scale vs carbon number. The observed trend is
consistent with an Anderson-Schulz-Flory distribution, compatible with step-growth
polymerization during formation by Fischer-Tropsch type reactions. Methane is elevated
with respect to the typical distribution, as indicated by the arrow.

For commercial use or higher resolution please contact Debbie Kelley